Established the UX foundation for an enterprise investigation platform, from zero
Overview
A global operational organization relied on spreadsheets, email, local trackers, and disconnected communication channels to investigate events and assemble service-quality reports. I helped establish the original UX foundation for a centralized platform, including the full high-fidelity design and component system, that brought investigation, collaboration, reporting, and knowledge capture into one structured experience.
The challenge
My approach
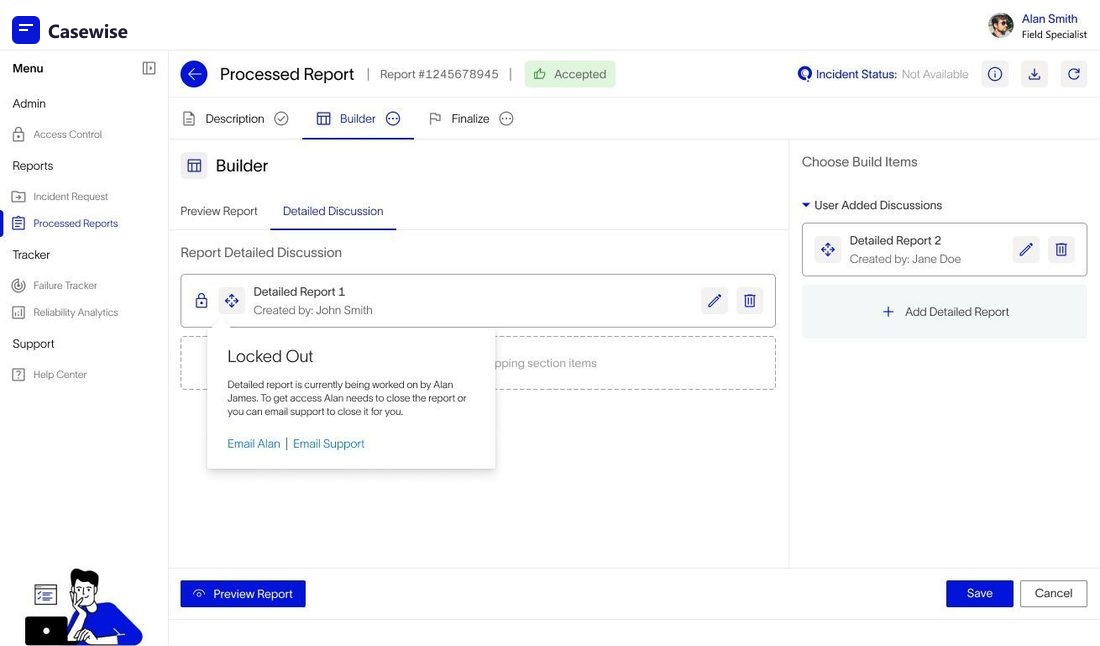
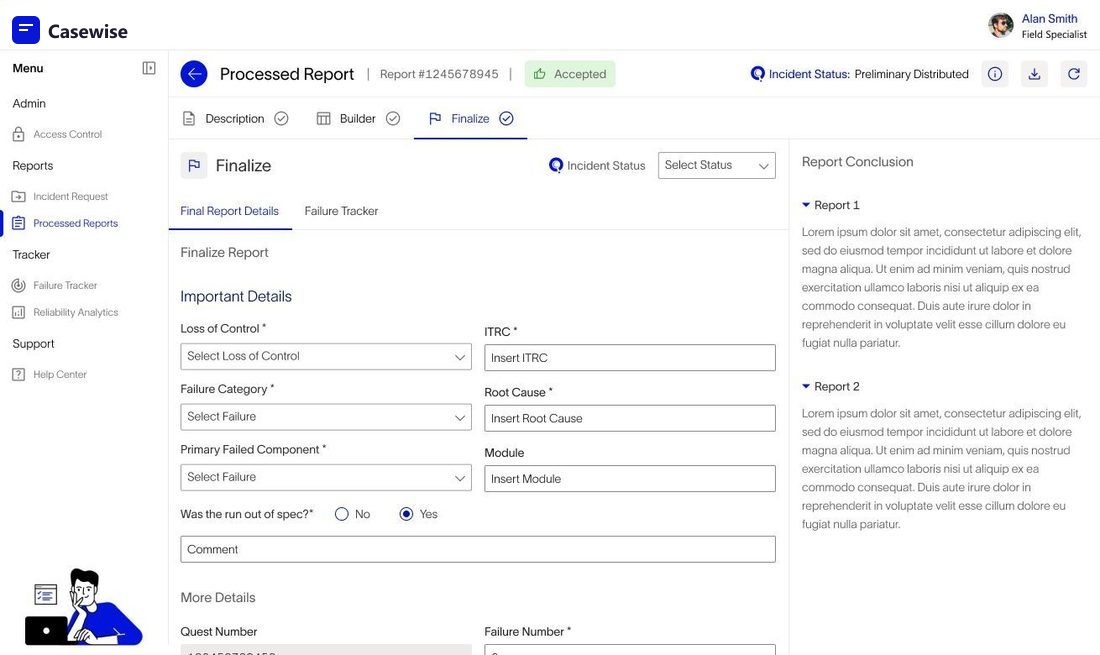
I mapped the reporting and investigation experience and reframed it into three clear phases: Describe, Build, and Finalize, each one separating foundational context, collaborative contribution, and final decision-making.
I defined the page structures, user flows, role transitions, and interaction patterns needed to move work from initial description through collaborative report development to final output.
I selected a mature enterprise UI framework and used it to define button hierarchy, spacing, grids, states, iconography, and typography, then designed the complete high-fidelity application on top of that system rather than building every component from scratch.
I built a working prototype from the high-fidelity designs and ran walkthroughs with product owners and users to validate comprehension of the phased workflow and its fit with the original problems.
Key deliverables
Selected artifacts
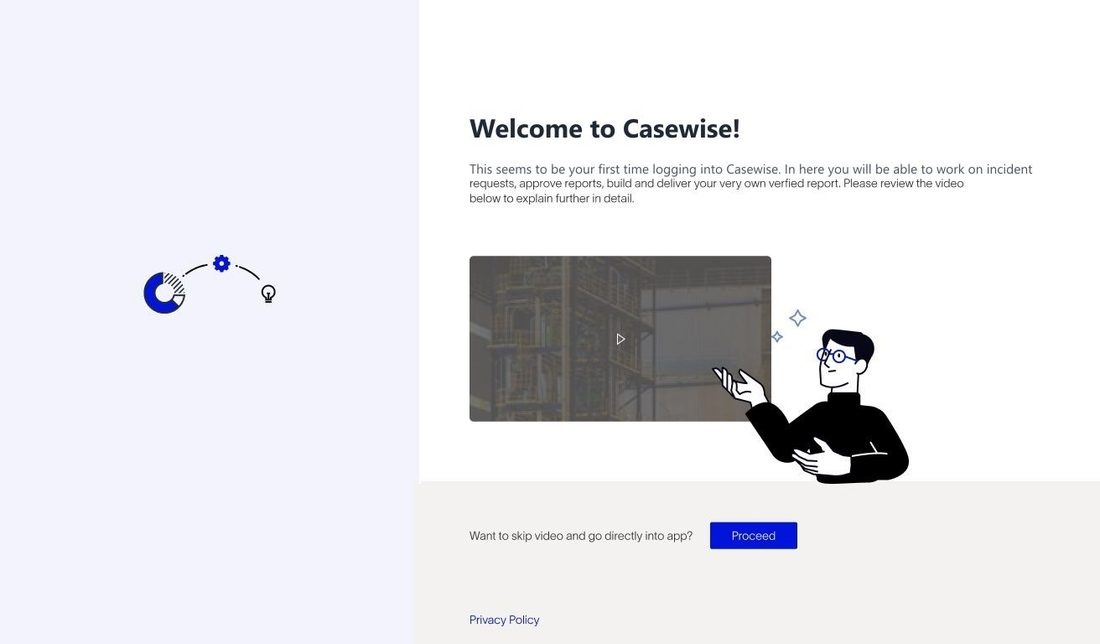
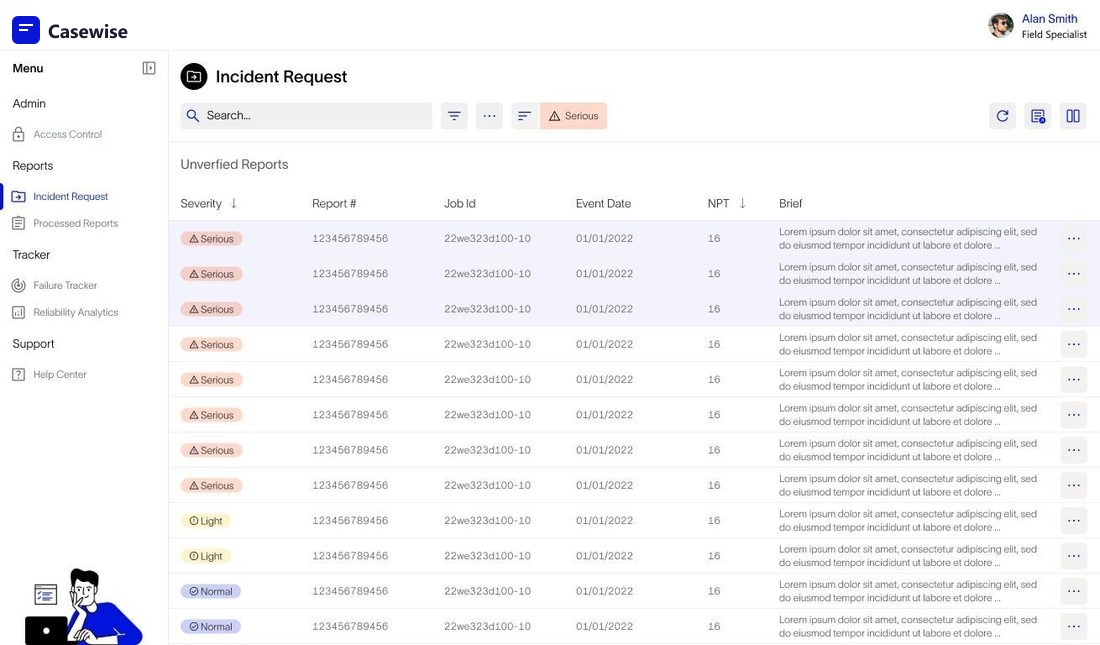
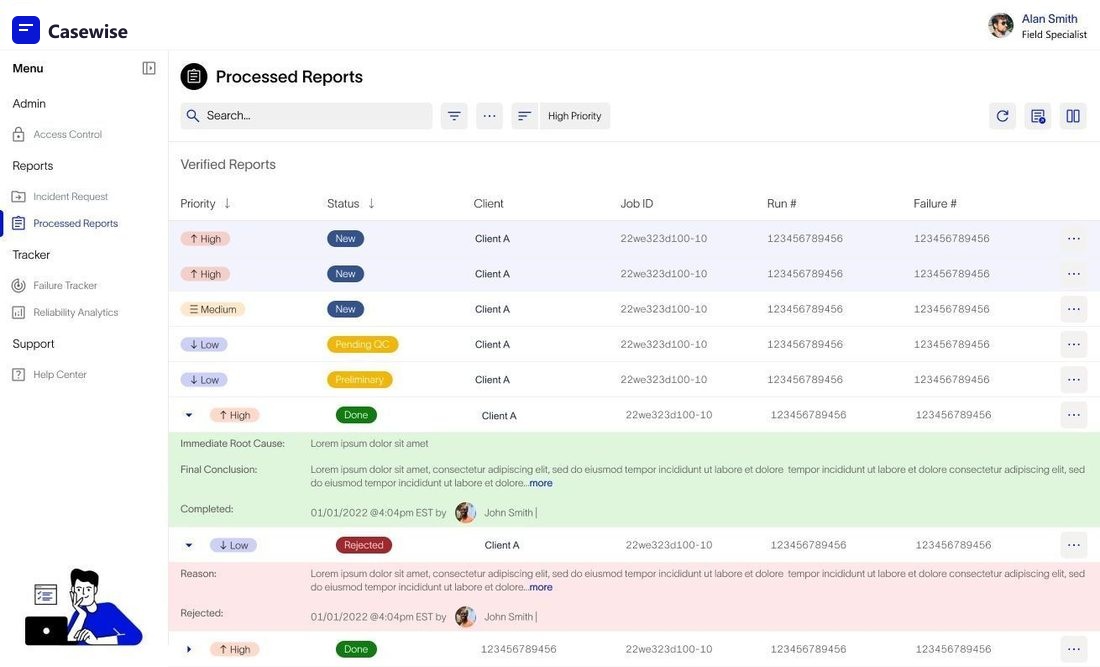
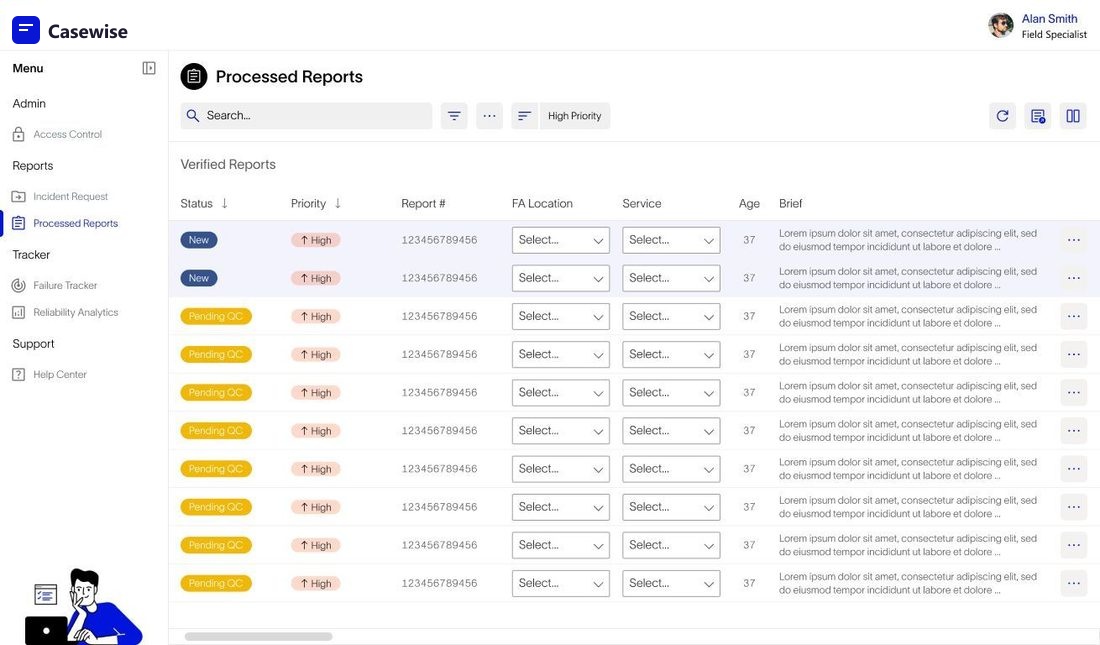
Actual screens from the shipped product. Employer references, vendor account details, and client names have been redacted to protect confidentiality; everything else reflects the real design.
Want a closer look at the real work? Get in touch.
Outcome
The design was approved and moved into development. The platform later operated as a production solution with event investigation, incident tracking, reliability analytics, final report creation, and consolidated information management. A later adoption update showed real, meaningful usage across participating regions — I'm not publishing the exact figures here, since they're specific enough to be identifiable.
What this demonstrates
What I'd validate next
I'd want to see usage data broken out by the phase that was actually struggling, Describe, Build, or Finalize, since the adoption number on its own doesn't say whether the phased model is working as intended or whether one phase is the bottleneck.
Have a similar problem?
If a product's structure has stopped matching how people actually use it, I'd genuinely love to hear about it.
Say hello